
Developer Cost in 2026: A Transparent Breakdown By Role And Seniority

Developer cost depends on role, seniority, region and engagement model, not one market rate. US software developers averaged $71.20 an hour in wages alone (BLS, May 2025), while Asian vendor rates ran $24 to $41 (Accelerance, 2026). Salary, hourly rate and fully loaded cost are three different numbers.
Ask three suppliers what a developer costs and you can get $18 an hour, $55 an hour, and $140 an hour for what sounds like the same job.
All three can be honest quotes. They are answers to different questions, priced on different bases, in different markets, with different things bundled in.
That is the problem this guide solves. Developer cost is not one number, and the companies that budget badly are usually the ones who treated it as one.
Everything here is sourced and labelled. US employee wages come from the Bureau of Labor Statistics. Vendor hourly rates come from a survey of 60 outsourcing partners. Where those two disagree, the disagreement is the point.
You will get rates by role and seniority, the fully loaded cost of an employee, the costs that never appear in a quote, and a checklist for reading one.
Where no reliable public figure exists, this guide says so rather than filling the gap.
How much does a developer cost?
There is no single developer cost. In 2026 the same job can carry a fully loaded employer cost above $200,000 a year in the United States or a vendor rate under $30 an hour in South Asia.
The four numbers below are not comparable with each other. Each answers a different question.
| Figure | What it measures | 2026 benchmark | Source |
| Employee wage | Gross pay only, no benefits | $71.20/hr mean, US software developers | BLS OEWS, May 2025 |
| Fully loaded employer cost | Wage plus benefits and employer costs | Benefits add roughly 43% on top of wages | BLS ECEC, March 2026 |
| Vendor hourly rate (Asia) | What an outsourcing firm bills | $24 to $31 junior, $31 to $41 senior | Accelerance, 2026 guide |
| Vendor hourly rate (Europe) | What an outsourcing firm bills | $31 to $39 junior, $64 to $76 senior | Accelerance, 2026 guide |
One comparison from that table is worth pausing on. A senior developer billed through an Asian vendor can cost the same per hour as a junior developer billed through a European one.
Location moves price far more than seniority does. Any budget built on seniority alone will be wrong by a wide margin.
Developer salary vs hourly rate vs fully loaded cost

Most bad developer budgets come from comparing a salary to an hourly rate. They do not measure the same thing.
A salary is gross pay to an employee. It excludes employer taxes, benefits, equipment, and the cost of the hours nobody bills for.
An hourly rate is what a supplier charges for time worked. It usually includes the supplier’s own overhead and margin, and it is only charged when someone works.
A fully loaded cost is what the person costs your business per year, all in. This is the only number that belongs in a budget.
Dividing a salary by 2,080 hours to get an hourly comparison understates the real cost badly. It ignores benefits, paid leave, and every non-billable hour.
Developer cost by role: what US wage data shows
The table below is US employee wage data only, from the BLS Occupational Employment and Wage Statistics survey, May 2025 reference period. These are wages, not vendor rates, and not fully loaded costs.
| Occupation (BLS classification) | Mean hourly wage | Mean annual wage | Median hourly wage |
| Computer and information systems managers | $92.39 | $192,160 | $84.20 |
| Software developers | $71.20 | $148,100 | $65.38 |
| Database architects | $69.44 | $144,440 | $67.07 |
| Computer network architects | $67.11 | $139,580 | $64.45 |
| Information security analysts | $63.71 | $132,510 | $62.11 |
| Data scientists | $60.96 | $126,800 | $57.80 |
| Computer systems analysts | $55.10 | $114,610 | $50.89 |
| Software QA analysts and testers | $53.60 | $111,490 | $50.14 |
| Computer programmers | $50.56 | $105,170 | $48.26 |
| Web developers | $47.49 | $98,770 | $44.54 |
Two things are missing from that list, and the absence is informative.
BLS has no separate classification for AI or machine learning engineers. The closest published categories are data scientists and a catch-all computer occupations group with a $122,230 mean annual wage.
There is also no DevOps classification. That work is split across network architects, systems administrators, and software developers depending on how the employer coded the role.
So when a vendor quotes you an “AI engineer rate” or a “DevOps rate,” there is no government benchmark to check it against. Ask what the person actually does instead.
Note the spread within the software developer category itself. As of the May 2024 release, the bottom 10% of US software developers earned under $79,850 and the top 10% earned over $211,450.
That is a 2.6x range inside a single job title, in a single country. Job title alone tells you almost nothing about cost.
Developer cost by seniority
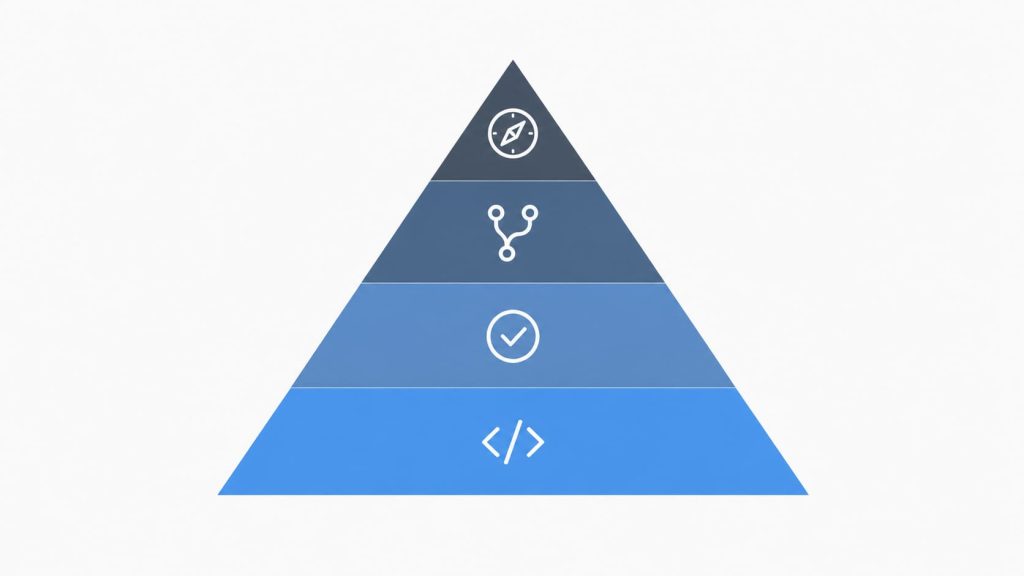
Seniority is not years served. It is the size of the decision someone can be trusted to make alone, and that is what the price reflects.
Junior developer cost and where juniors fit
A junior developer writes code against a specification someone else wrote. They work well on bounded tasks with clear acceptance criteria and existing patterns to follow.
They are the cheapest per hour and rarely the cheapest per outcome, because their work needs review. Budget senior time for that review or the saving evaporates.
Juniors make sense when you have strong technical leadership and repeatable work. They are a poor fit for a team with no senior engineer to supervise them.
Mid-level developer cost and where the work should sit
A mid-level developer takes a described problem and ships a working solution without close supervision. They handle their own testing and ask for help at the right moments.
This is where most execution work should sit. Companies routinely overpay by putting senior engineers on tasks a mid-level developer would do just as well.
Senior developer cost and what the premium buys
Senior developers are paid for judgement. They know which approaches will fail before the team spends three weeks discovering it.
Their value shows up in work that never happens: the rewrite avoided, the outage prevented, the design that stayed maintainable at scale.
They also make everyone around them faster through review and mentoring. That leverage is why a senior costs more per hour and often less per outcome.
Tech lead and architect cost
Tech leads own how the system fits together, how teams coordinate, and which technical risks the business is accepting.
The premium here is small in headcount terms and large in consequence. One architectural decision can determine your maintenance cost for years.
Most teams need less of this than they buy. A fractional or part-time architect is often the right answer for a team under ten engineers.
Why do some developers cost three to five times more?
Six factors explain nearly all of the spread. They compound, which is how a rate triples.

Seniority and decision-making
Nobody pays a premium for code volume. They pay for correct decisions under uncertainty, which is the scarce part.
Technology scarcity
Skills in short supply command premiums regardless of geography. In 2026 that includes machine learning and LLM engineering, cloud architecture, Kubernetes at scale, data engineering, and security.
The premium tracks how few people can do the work, not how new the technology is. React and Node.js developers are plentiful and priced accordingly.
Be careful here. Published percentage premiums for specific technologies are mostly vendor marketing, not measured data. Treat any precise figure with suspicion unless it names a methodology.
Geography and local labor markets
Local labor markets set the floor. The Accelerance 2026 data shows senior developers at $31 to $41 an hour in Asia and $64 to $76 in Europe.
Location does not determine quality. It determines the cost of living the salary has to cover, which is a different thing.
What the rate includes
Two quotes for the same seniority can differ by 40% because one includes QA, project management, and a replacement guarantee and the other includes a person.
Communication and business skills
A developer who can sit with your product owner, challenge a requirement, and translate a business problem into a technical one removes a whole coordination layer.
That capability is priced in. It is also the hardest thing to assess in an interview, which is why it is often underweighted by buyers.
Accountability and vendor-backed delivery
Vendor-backed delivery with security processes, compliance evidence, and contractual replacement costs more than a freelancer. You are buying a guarantee, not just hours.
What does a developer actually cost a company?

Salary is roughly 70% of what an employee costs. The rest is invisible until you build the budget.
BLS Employer Costs for Employee Compensation data for March 2026 puts private industry wages at $32.60 per hour worked, or 69.9% of total employer cost, with benefits at $14.01, or 30.1%.
Stated the other way: benefits add about 43% on top of wages. That is an economy-wide private industry average, not a developer-specific figure.
Employer costs also rise with pay level. The same release shows total compensation of $34.78 per hour at the median wage percentile and $89.70 at the 90th percentile.
Software developers sit well above the 90th percentile of private wages, so treat $89.70 as a floor rather than an estimate.
Apply the ratio to the BLS mean software developer wage of $71.20 an hour and benefits alone add roughly $30. That is before recruitment, equipment, software licences, office space, or management time.
This is why a lower salary does not reliably mean a lower cost. The loading is a percentage, so it scales with the salary rather than offsetting it.
The hidden costs of hiring developers
These are real, recurring, and absent from every rate card.
Recruitment consumes senior engineering hours in screening and interviews, whether or not you pay an agency fee. That time has a loaded cost too.
Onboarding takes weeks before anyone is productive on an unfamiliar codebase. You pay full rate throughout.
Management is the cost people forget entirely. Every additional engineer consumes engineering manager time, and managers have a finite span of control.
Infrastructure, licences, and tooling recur monthly per seat. Cloud environments, IDE licences, and observability tools add up quickly across a team.
Turnover resets the clock. BLS reported median employee tenure at 3.9 years in January 2024, the lowest since 2002, so build replacement into any multi-year plan.
Knowledge loss is the expensive part of turnover. Undocumented context leaves with the person and gets rediscovered at full rate.
Idle capacity is the quiet one. A permanent hire is paid whether or not there is work this month. An hourly engagement is not.
Developer rates by engagement model
Pricing structure matters as much as the number attached to it.
| Model | How it is priced | Best for | Main advantage | Main consideration |
| Freelance | Hourly or daily, per person | Small bounded tasks | Lowest overhead, fast to start | No delivery guarantee, availability risk |
| Staff augmentation | Monthly rate per person | Filling a specific skill gap | You keep full control | Your managers absorb the management load |
| Dedicated team | Monthly rate per team | Continuous product work | Provider manages delivery | Longer commitment, slower to reshape |
| Project outsourcing | Fixed price or milestone | Well-defined scope | Cost certainty | Change requests get expensive |
| In-house hiring | Salary plus loading | Core long-term capability | Full ownership and retention | Highest fixed cost, slowest to scale |
| Hybrid | Mixed | Core plus periodic specialists | Continuity with flexibility | Needs one clear delivery owner |
No model is universally cheaper. Fixed price shifts risk to the supplier and they price that risk in. Time and materials shifts it to you and costs less when scope is stable.
What does an outsourcing rate actually include?
A vendor rate is not a salary plus markup. That framing leads buyers to negotiate against the wrong thing.
The margin covers recruitment, employment and payroll, HR and compliance, office and infrastructure, bench capacity for replacements, delivery management, and often QA and security processes.
Some of that duplicates what you would spend anyway. Some of it is capability you would otherwise have to build.
The useful question is not how much margin the vendor makes. It is which of these functions you would have to staff yourself, and what those would cost you.
If you already have recruiters, HR, engineering managers, and QA, you are paying twice for some of it. If you have none of those, the rate is buying an operating model.
Developer rates by region in 2026
The figures below are vendor billing rates from the Accelerance 2026 Global Software Development Rates and Trends Guide, based on a survey of 60 software development partners, published November 2025.
| Region | Junior developer | Senior developer | Year-on-year change |
| Asia | $24 to $31/hr | $31 to $41/hr | Effective rates down close to 8% |
| Europe | $31 to $39/hr | $64 to $76/hr | Down 4.4% |
| Latin America | $33 to $45/hr | $60 to $75/hr | Down 7.1% |
Rates fell across every major outsourcing region, which is unusual. Accelerance attributes it to competition, automation, and a growing pool of AI-augmented developers.
Two limitations matter. A 60-partner sample is small, and Accelerance certifies the partners it surveys, so these are vetted providers rather than the whole market.
Note the compression in Asia. Junior and senior bands nearly touch at $31, meaning seniority buys less price separation there than in Europe or Latin America.
No comparable public benchmark exists for US or UK vendor rates in this dataset. For those markets the employee wage data above is the better anchor.
For the UK specifically, ITJobsWatch recorded a median advertised software developer salary of £57,500 in the six months to May 2025, with a 10th percentile of £41,000 and a 90th of £122,500.
That is advertised-vacancy data from 357 quoted salaries, not employer-reported pay. ONS Annual Survey of Hours and Earnings is the authoritative UK alternative, though it groups programmers and software development professionals together.
India developer rates: what to expect in 2026
Two separate numbers get confused here constantly, and the confusion costs buyers money.
The first is what Indian developers earn. Glassdoor’s India data, drawn from 80,777 self-reported salaries as of June 2026, puts the average software developer salary at ₹672,500 a year.
The distribution in that dataset runs from ₹415,002 at the 25th percentile to ₹1,215,000 at the 75th and ₹2,180,000 at the 90th.
The second is what a vendor bills. Accelerance puts Asian vendor rates at $24 to $31 an hour for juniors and $31 to $41 for seniors.
Convert the salary figure at the current exchange rate over 2,080 working hours and you will find a large gap between the two. That gap is not pure profit.
Sitting inside it are employer contributions, recruitment, HR and compliance, office and infrastructure, bench capacity, delivery management, QA, and non-billable time including leave and training.
These are market benchmarks, not DSGGTech quotations.
Be honest about the data quality here. No authoritative public source publishes India vendor rates broken out by role and seniority the way BLS publishes US wages.
Indian salary data comes mainly from self-reported platforms, and published averages vary widely because they blend IT services firms with global capability centres and product companies paying several times more.
City matters too. Bengaluru, Hyderabad, Pune and Delhi NCR price differently from tier-two cities, and specialist skills in machine learning and cloud architecture break the pattern entirely.
Treat any single “India developer rate” as marketing. Ask for the specific role, seniority, city, and what the rate includes.
What should you budget for a development team?
Individual rates are the wrong unit. Products are built by teams, and team shape drives cost more than any individual rate.
The figures below are arithmetic, not quotes. They apply the Accelerance regional bands at 160 hours per month. Accelerance publishes junior and senior developer bands only, so QA is proxied at the junior band and management at the senior band.
MVP team: roles and monthly cost
One senior full-stack developer, one junior developer, one QA engineer, and a part-time project manager.
Using the Asian bands, that is roughly $15,100 to $19,800 a month. Using the European bands, roughly $22,000 to $27,400.
The senior is non-negotiable here. An MVP is mostly architectural decisions, and getting those wrong is more expensive than the whole team.
SaaS product team: roles and cost drivers
Add a second mid-level developer, a designer, and dedicated DevOps capability as the product moves from launch to scale.
Cost roughly doubles against the MVP team. The driver is not rate inflation but headcount and the addition of specialist roles.
Enterprise application team: roles and cost drivers
Expect a tech lead, several developers across frontend and backend, QA, DevOps, a business analyst, and a project manager.
Enterprise work carries costs the others do not: security review, compliance evidence, integration with legacy systems, and coordination across internal stakeholders. Budget for the coordination, because it is substantial.
AI product team: roles and where benchmarks run out
A core engineering team plus machine learning capability and data engineering.
This is where public benchmarks run out. Neither BLS nor Accelerance publishes a separate machine learning engineer rate, so any figure quoted to you is a vendor’s own pricing rather than a market benchmark.
Insist on knowing what the person has actually shipped. The gap between someone who has deployed models in production and someone who has completed courses is enormous and not visible in a CV.
Why the cheapest developer is rarely the cheapest option
A low rate multiplied by low productivity, plus rework, plus management overhead, can exceed a higher rate that delivers first time.
Accelerance’s Olivier Poulard puts it directly, calling hourly rates <cite index=”64-1″>”a poor measure of the true cost of software development”</cite>.
The mechanism is not mysterious. Cheaper teams often need more specification, more review, more rework, and more of your senior engineers’ attention.
Code quality compounds. Poor architecture makes every subsequent feature slower, and you pay that tax for the life of the system.
Testing gaps move cost downstream, where defects cost far more to fix than they would have in development.
The metric that matters is cost per outcome, not cost per hour. A team that ships a working feature in three weeks at $60 an hour beats one that takes ten weeks at $25.
That said, the reverse trap is real too. Paying premium rates does not guarantee quality either, and plenty of expensive teams deliver slowly. Rate is a weak signal in both directions.
How to evaluate a developer quote: 15 questions to ask
Run every quote through these questions. Most rate differences dissolve once you have the answers.
- What seniority is included, and how is seniority defined?
- Is the developer full-time and exclusive to you?
- Which technologies are covered by this rate?
- Is QA included or billed separately?
- Is project management included?
- Is technical leadership or architecture included?
- What happens if the developer leaves, and who pays for the ramp-up?
- Are tools, licences, and infrastructure included?
- Is the rate fixed for the term, or subject to review?
- Is there a minimum commitment or notice period?
- What timezone overlap is guaranteed?
- What security and compliance processes are included?
- Who owns the intellectual property, and when does it transfer?
- How are holidays, sick leave, and training days billed?
- How quickly can the team scale up or down?
Question seven is the one buyers skip and regret. Replacement terms are where cheap engagements become expensive.
How to reduce developer cost without cutting quality
Cutting rates is the least effective lever available. These work better.
Fix your seniority mix. Most teams are senior-heavy at the top and thin in the middle, which is the most expensive possible shape.
Use seniors for architecture, review, and the decisions that are hard to reverse. Use mid-level developers for execution.
Improve requirements before development starts. Ambiguity is the single largest source of rework, and rework is billed at full rate.
Automate repetitive testing and deployment. This reduces the hours spent on work that does not need a human.
Match the model to the need. Use augmentation for temporary gaps and a dedicated team for continuous work, rather than defaulting to one.
Cut meetings that do not produce decisions. Ten engineers in a status meeting is a real line item at these rates.
Establish clear technical ownership. Shared ownership means decisions stall, and stalled decisions are paid for by the hour.
What does not work is hiring the cheapest available talent and hoping. That reliably moves cost from the rate card into the rework budget.
Dedicated team vs staff augmentation: which is more cost effective?
Neither, in the abstract. They are cheaper in different situations.
A dedicated team tends to cost less over a long roadmap, because the provider absorbs recruitment and management, and the team’s accumulated product knowledge reduces waste over time.
Staff augmentation tends to cost less for bounded work, because you pay only for the specific gap and can release capacity when the need ends.
The break-even depends on engagement length and your internal management capacity. If your engineering managers are already at their limit, augmentation is not as cheap as the rate suggests.
Read the detailed comparison of dedicated vs staff augmentation.
How much should you pay for a developer?
There is no universal number, but there is a reliable way to build one.
Developer cost = role + seniority + location + specialization + engagement model + what the rate includes
Work through those six in order. Each narrows the range, and by the sixth you have a defensible budget rather than a guess.
Then sanity-check it against a published benchmark for the same category. A vendor rate against vendor data, a salary against wage data, never one against the other.
Frequently asked questions about developer cost
How much does a software developer cost?
It depends on whether you are hiring or contracting. US software developers averaged $71.20 an hour in wages alone in May 2025 according to BLS, with benefits adding roughly 43% on top.
Vendor rates through outsourcing partners ranged from $24 to $76 an hour in 2026 depending on region and seniority.
What is the average developer hourly rate?
There is no single average, and any source quoting one is blending incompatible categories. BLS puts the mean US software developer wage at $71.20 an hour, but that is employee pay, not a billable rate.
Accelerance puts 2026 vendor rates between $24 and $76 depending on region and seniority.
How much does a junior developer cost?
Through outsourcing vendors in 2026, Accelerance reports $24 to $31 an hour in Asia, $31 to $39 in Europe, and $33 to $45 in Latin America.
For US employees, the bottom 10% of software developers earned under $79,850 a year as of the May 2024 BLS release. Budget senior review time on top.
How much does a senior developer cost?
Vendor rates in 2026 ran $31 to $41 an hour in Asia, $60 to $75 in Latin America, and $64 to $76 in Europe, according to Accelerance.
For US employees, the top 10% of software developers earned over $211,450 a year in the May 2024 BLS data, before benefits and employer costs.
How much does a developer cost in India?
Two different numbers apply. Glassdoor’s self-reported India data as of June 2026 shows an average software developer salary of ₹672,500, with a 75th percentile of ₹1,215,000.
Vendor billing rates across Asia ran $24 to $41 an hour in the Accelerance 2026 guide. The gap covers employment, overhead, and non-billable time.
Are outsourced developers cheaper than in-house developers?
Usually on the headline rate, and not always in total. Outsourcing removes recruitment, benefits, and infrastructure costs but adds vendor margin and coordination overhead.
In-house hiring costs more per head but retains knowledge. The comparison only works if you use fully loaded costs on both sides.
How much does a dedicated developer cost?
Dedicated developers are typically priced monthly rather than hourly, at rates similar to staff augmentation for the same seniority and region.
What varies is what “dedicated” means. Confirm full-time allocation, exclusivity, working hours, replacement policy, and whether QA and management are included before comparing quotes.
How much does staff augmentation cost?
Staff augmentation is normally billed as a monthly rate per person, set by seniority, specialisation, region, contract length, and what the provider includes. Longer commitments usually attract lower rates.
The cost most buyers miss is internal. Augmented engineers consume your managers’ time, which is a real expense.
Why do developer rates vary so much?
Six factors compound: role, seniority, geography, skill scarcity, engagement model, and what the rate bundles in. Geography alone can move price several times over.
A senior developer in Asia can bill roughly what a junior in Europe does, which is why job title and seniority together still do not predict cost.
Is a higher developer rate worth it?
Sometimes. Higher rates often buy judgement, fewer defects, and less of your own management time, which lowers cost per outcome even at a higher cost per hour.
But rate is a weak quality signal in both directions. Evaluate what someone has shipped, not what they charge.
Final takeaway: budget for capability, not headcount
Do not budget for a developer. Budget for the capability, the responsibility, and the outcome you actually need.
Six things set the number: role, seniority, location, specialisation, engagement model, and what the rate includes. Get those six right and the budget follows.
Then compare like with like. Salary against salary, vendor rate against vendor rate, and fully loaded cost against fully loaded cost. Most budget failures start with a comparison between two of those.
The cheapest rate is not the cheapest outcome, and the most expensive rate is not a guarantee of quality. Cost per outcome is the only metric that survives contact with a real project.
DSGGTech can help you work out which roles and seniority mix your project actually requires, and which engagement model fits your team, before you commit to a budget. Talk to our technology specialists about what you are building.